

Every week, on every news channel, you see the numbers move. Population and migration going up. Building approvals and housing affordability going down. It's a key topic in politics. But when it comes to the stories about how to actually fix it, they all seem to fade away or miss their mark. These numbers tell that story.
So let's look at the math, because the math is what actually drives prices and rents (not the headline of the week).
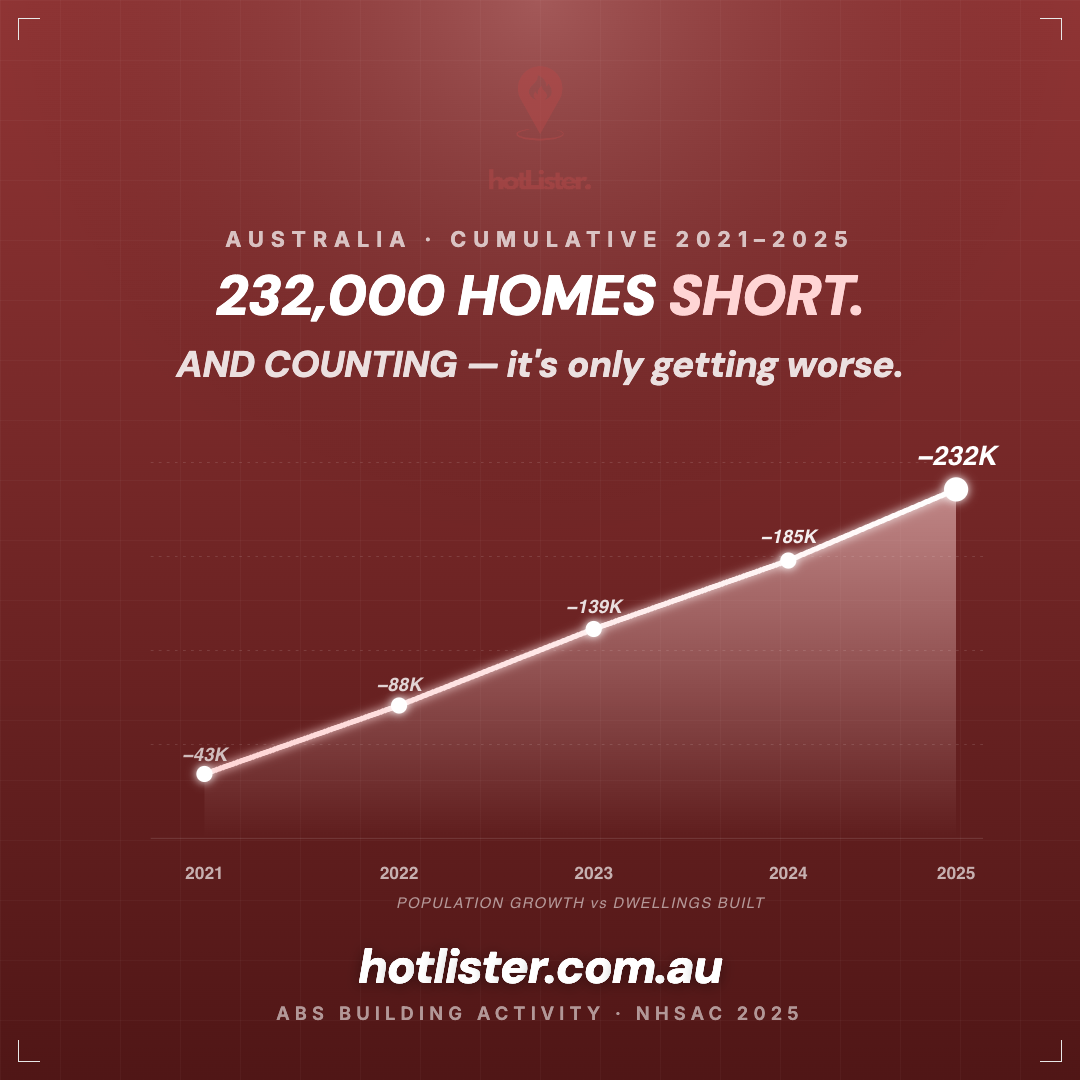
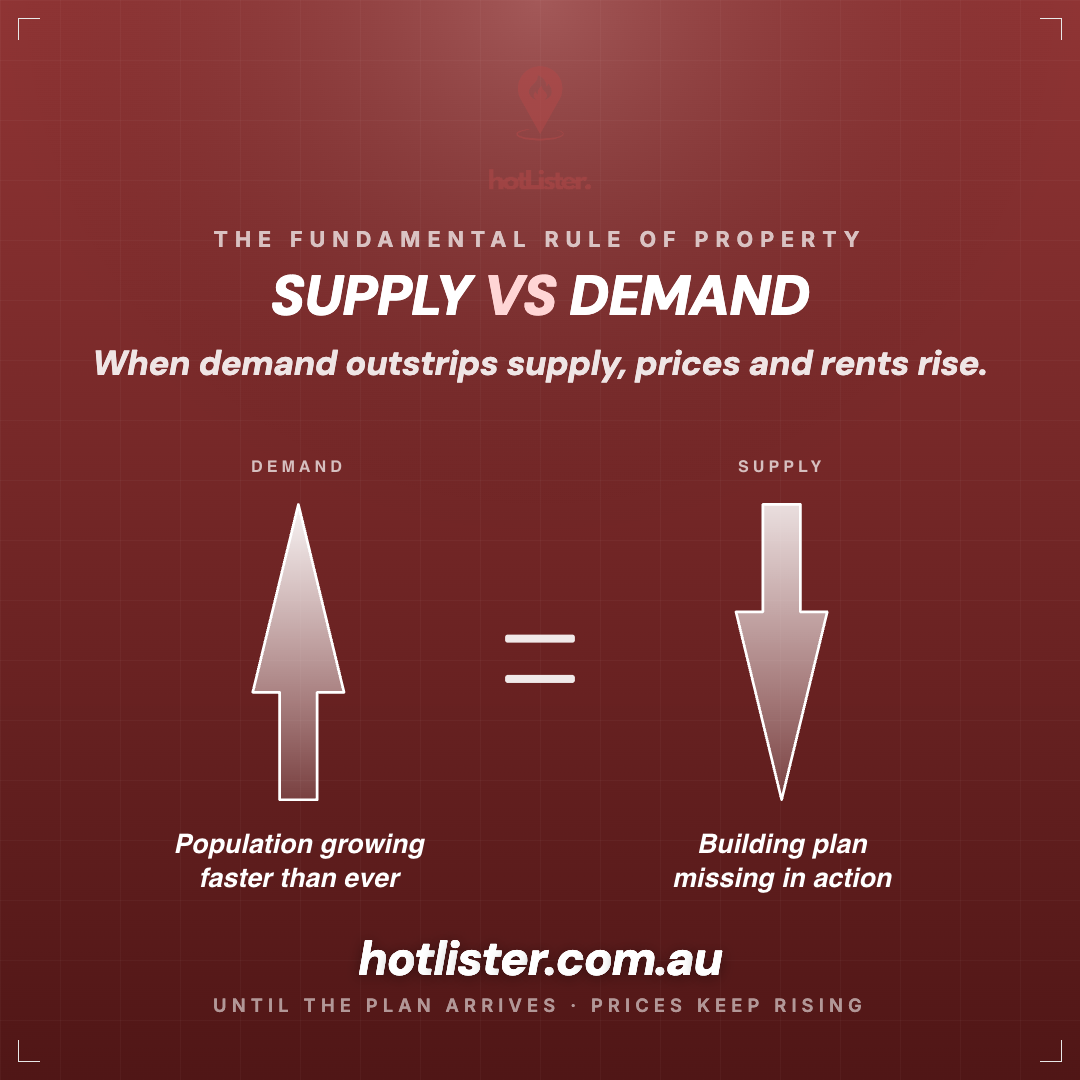
From the start of January 2021 to the end of December 2025, Australia added 2.18 million people. Over the same five years we built around 530,000 homes. Houses, units, townhouses, the lot. That's the story in one line.
This isn't a rates story anymore
When the RBA hit 4 percent in 2024, I (like many Aussies) thought it might play a hand in prices stagnating or slowly starting to fall. We got the opposite.
The cash rate sits at 4.35 percent in May 2026, after a third hike this year. National home values still rose 9.9 percent in the twelve months to April 2026 (Cotality Home Value Index). The fastest annual pace since June 2022. If rate rises stopped property, that second number would not exist.
Rents tell the same story from a different angle. National rental vacancy is at 1.0 percent. The historical balanced market is somewhere around 2.5 to 3.5 percent. There are less than half the rentals available compared to what a normal market would look like. That's the supply side asserting itself, not demand cooling off.
When supply doesn't respond, every demand-side lever becomes a price-and-rent lever. The cash rate is a demand-side lever.
What demand looks like
Look at the two lines on the next chart. They tracked each other reasonably well for a decade. Then 2022 hit, and the population line jumped to a level the building line has never been near.
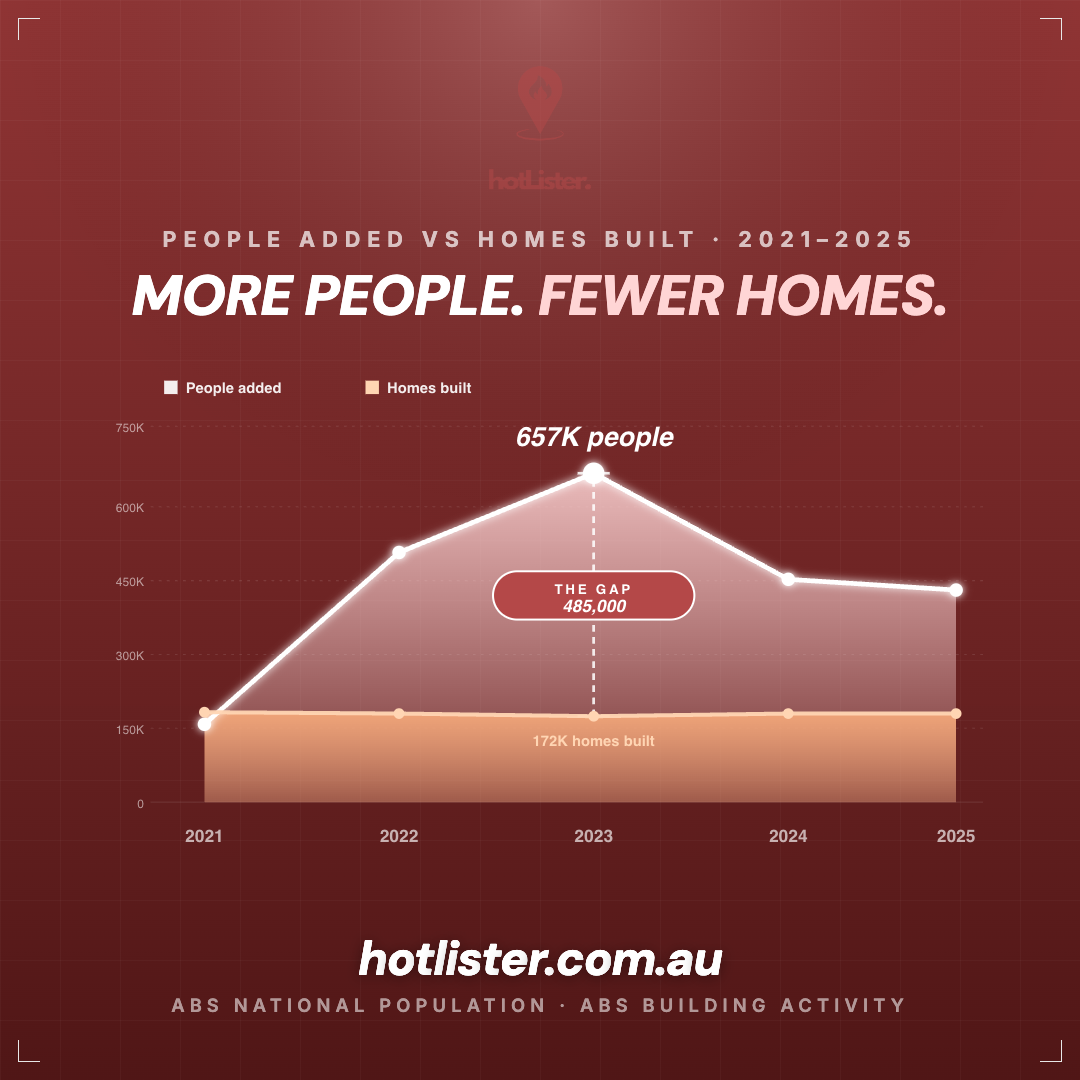
The numbers, year by year:
2021 ran cold (closed borders, COVID hangover). Total population growth was 128,000 people (net overseas migration was actually negative that year, with natural increase carrying all the growth). We built about 180K dwellings. The only surplus year in the series.
2022 opened the borders and the country added 496,800 people. Construction stayed flat at roughly 178K homes.
2023 was the record. Net overseas migration of 547,200, plus another 110,000 from natural increase, took total population growth to around 657,000. Dwelling completions fell to 172,000 (the lowest annual figure in a decade). Demand-vs-supply ratio that year: 3.8 people for every new home built.
2024: 446,000 population growth against 177,000 new homes. 2025: around 423,600 growth against an estimated 176,000 new homes. The early 2026 data already points to another record. ABS net permanent and long-term arrivals over the 12 months to January 2026 hit 494,540 (the highest figure on record).
Where the demand actually came from
Three in every four new Australians since 2021 arrived from overseas. Think about that.
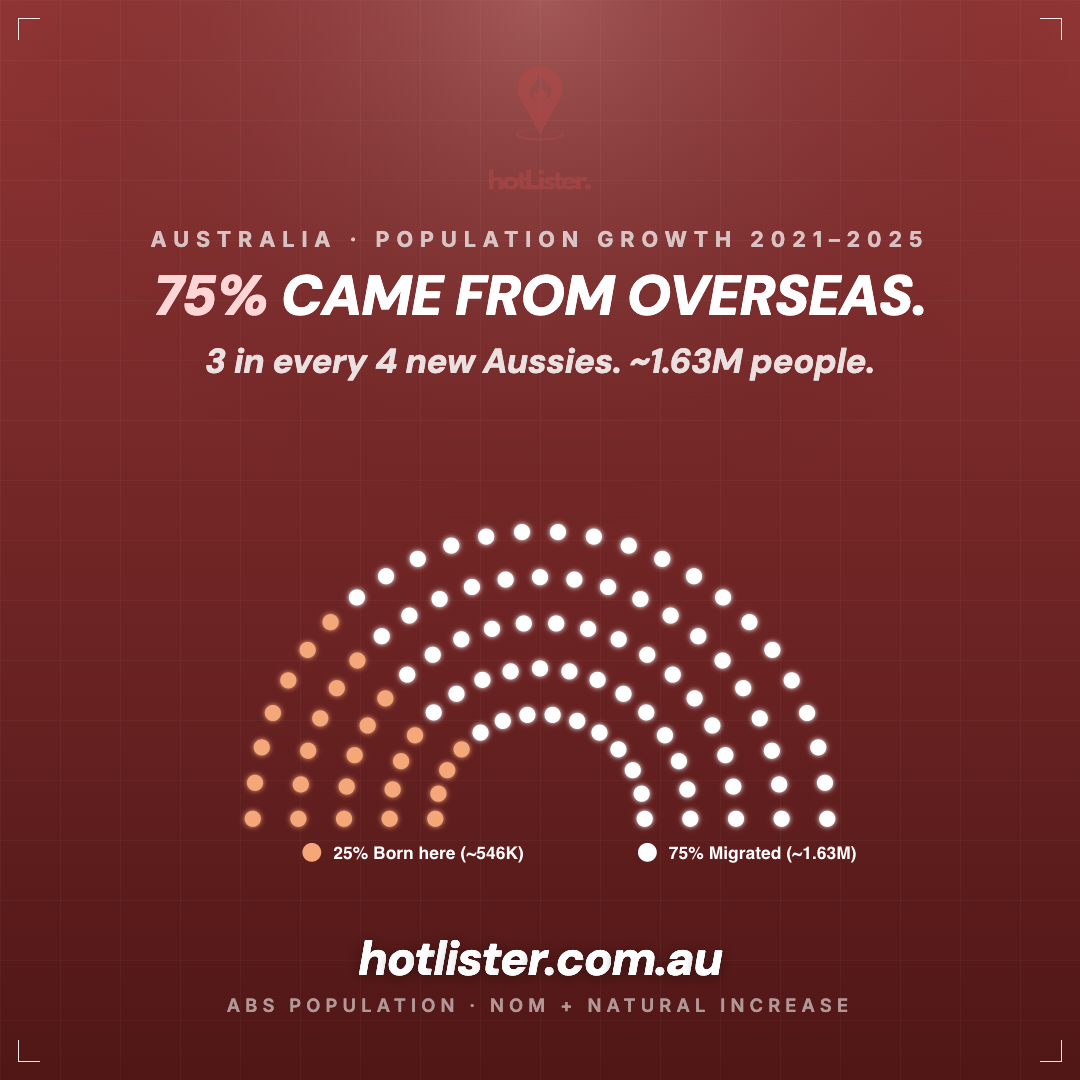
This isn't about whether migration is a good thing. Migration brings workers, taxpayers, students and skills the country needs. The point is more mechanical. When you add 1.63 million people to the demand side and only put 530,000 homes on the supply side, the housing market does what physics says it has to do. Prices rise. Rents rise. Vacancy collapses.
Why supply hasn't responded
The construction industry hasn't forgotten how to build. The systems wrapped around it have stopped letting it.
I've spoken to multiple builders around South-East Queensland over the last six months. They're constantly complaining about council approval times. Some councils that used to turn building approvals around in 4 to 5 weeks are now taking up to 4 months just to issue BA. More red tape. More steps. Slower process. This is the opposite of what we need right now.
It's not just one anecdote. The pattern shows up in every state's productivity reporting:
- Trade fill rate: Construction job ads only fill at about 57 percent. Nearly half of advertised tradie roles go unfilled.
- Build time: A standard new house took 9 months from approval to completion in 2010. By 2024 it took 12.7 months on average.
- Materials cost: The national house-building cost index rose more than 60 percent in five years.
- Planner approvals: A council planner approved an average 54 dwellings a year in 1986. Today the average is around 9 dwellings per planner per year. Some approval timelines blow out past twelve months.
- Government charges: The Housing Industry Association puts stamp duty, levies and GST at roughly 50 percent of the total price of a new Sydney house and land package, before construction even starts.
Each of these is a policy variable, not a market variable. The construction industry can build faster. The problem is that the rules around them haven't kept up with how fast the population is growing.
The NSW reality check
Nowhere is the gap between the announcement and the delivery clearer than in NSW.
The Minns Labor Government launched the Building Homes for NSW program in 2024, with a headline target of 30,000 dwellings on government sites, including 8,400 new public homes. That was the centerpiece of the state's housing response.
The most recent government data: about 1,711 new social and affordable homes built or brought back into use in the first twelve months of the program. The next 1,600 announced in early 2026 are sites, not finished homes.
The Transport Oriented Development program (the Premier's other big housing pitch) has zoning capacity for around 31,000 homes across 37 precincts. As of February 2026, around 18,000 of those had entered the planning system. Approvals stand at roughly 1,700.
The NSW Liberal opposition (using the state's own data) puts the National Housing Accord shortfall in the first six months at 14,001 homes against a six-month target of 37,700. NSW needs roughly 62,800 new dwellings a year over the next five years to do its share of the Federal Housing Accord. The current trajectory is about 36,000 a year. That projects to a 134,000-home shortfall in NSW alone over five years.
Capacity announced and homes occupied are very different things. The gap between those two is what investors should be watching, regardless of which party you back.
What it means for property prices
KPMG's January 2026 outlook has national house prices rising 7.7 percent in 2026, with units up 7.1 percent. Perth leads the capital city forecast at 12.8 percent house growth, Brisbane 10.9 percent, Darwin 10.5 percent. Even the slower capitals (Sydney, Melbourne and Canberra) are forecast to rise between 4.7 and 6.8 percent. Michael Yardney's Metropole projection has Sydney's median house price reaching around 1.92 million dollars by the end of 2026.
What investors should do
Property is a long-term asset. That doesn't mean you stop thinking. Three things matter right now, and they all follow from the math above.
The RBA moves demand. The cash rate doesn't move supply. The supply gap is what's setting the price trajectory now. Read the building approvals reports and the vacancy rate data. Read the rate page second.
Perth, Brisbane, Adelaide and a handful of regional growth corridors are where the math is most one-sided right now. Melbourne's discount to Sydney is at its widest in two decades, which historically reverts. Different markets cycle at different times.
Property is a long-term asset, full stop. The investors who looked at the population-versus-dwellings chart back in 2022 and bought are now sitting on capital gains the analysts only got around to forecasting in 2025. Skip the BBQ advice. The patient buyers always end up ahead.
The bottom line
Australia needs a housing plan that grows at the pace of the population. Right now we have announcements, shortfalls and council approval queues. Until that changes, prices and rents keep doing what the math says they have to do.
Let's see what the Federal Budget brings out this week. I'm not holding my breath for any great quick fixes, but let's see what hand they try to play. Read the supply numbers, not the rate page. That's where the next decade of Australian property is being written.